An IT manager can usually explain where a retired laptop went. The harder question arrives during an audit: which serial number was on that shipment, who handled it, when was the drive sanitized, what happened to the reusable equipment, and which certificate proves each step? A folder of spreadsheets may contain the answers, but it rarely presents them as one reliable operational record.
That's where business intelligence data becomes practical for IT asset disposition, or ITAD. It connects procurement records, asset tags, intake logs, chain-of-custody events, secure data destruction certificates, recycling weights, donation outcomes, and sustainability reporting. The result isn't just another dashboard. It's a governed evidence layer for decisions about risk, cost, compliance, reuse, and community impact.
Defining Business Intelligence Data for Physical Assets
Traditional BI conversations often focus on revenue, customer behavior, and SaaS performance. Physical IT assets require a different lens. A server, laptop, network switch, medical device, or laboratory instrument has a location, owner, condition, custody history, disposition route, and environmental consequence. Business intelligence data gives leaders a structured way to understand that lifecycle from acquisition through retirement.
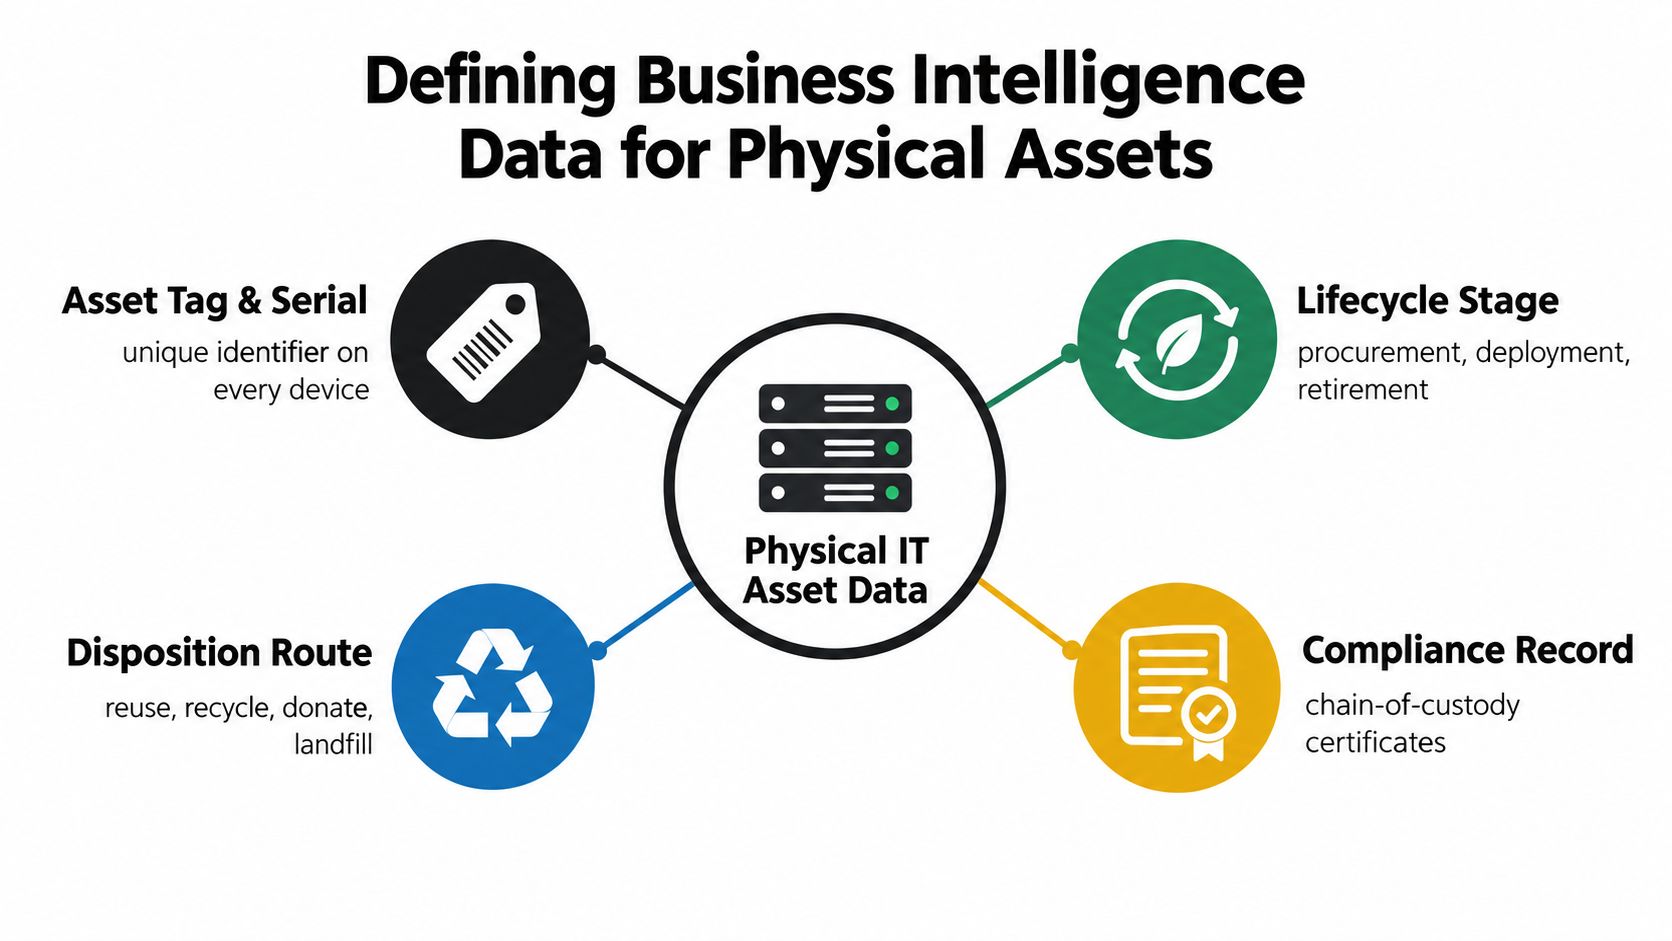
A useful definition is business intelligence data for physical assets, meaning cleaned, connected, and governed records that turn hardware events into decisions. Raw records might include purchase orders, configuration management database entries, barcode scans, warehouse receipts, transport manifests, repair notes, data destruction records, certificates of recycling, and weight tickets. By themselves, those records are fragmented. Combined through a controlled data model, they can show whether assets were reused, donated, recycled, or sent for disposal, and whether every transaction has supporting evidence.
The physical asset as a data product
Treating hardware lifecycle information as a governed data product changes how teams work. Finance needs accurate retirement status for fixed-asset records. IT needs visibility into devices awaiting collection. Facilities teams need pickup coordination for an office cleanout or facility cleanout. Sustainability leaders need defensible evidence for e-waste diversion and donation reporting. Security teams need restricted access to data destruction details.
A practical asset record should connect:
- Identity: Serial number, asset tag, manufacturer, model, and equipment category.
- Lifecycle: Procurement, deployment, repair, storage, retirement, and final disposition.
- Custody: Site, handler, transfer date, shipment, and receiving confirmation.
- Outcome: Reuse, donation, recycling, product destruction, or disposal.
- Evidence: Certificates, photographs where appropriate, manifests, and approval records.
The asset lifecycle management guide provides useful context for connecting these stages instead of treating retirement as an isolated event. That connection matters because a recycling certificate without an asset identifier may prove that material was processed, but it may not prove which specific device was included.
Building ETL Pipelines and Ensuring Data Quality
A dashboard can be visually polished and still be analytically wrong. The failure usually begins before visualization, when teams combine spreadsheets, CMDB exports, shipping records, and vendor reports without agreeing on definitions.
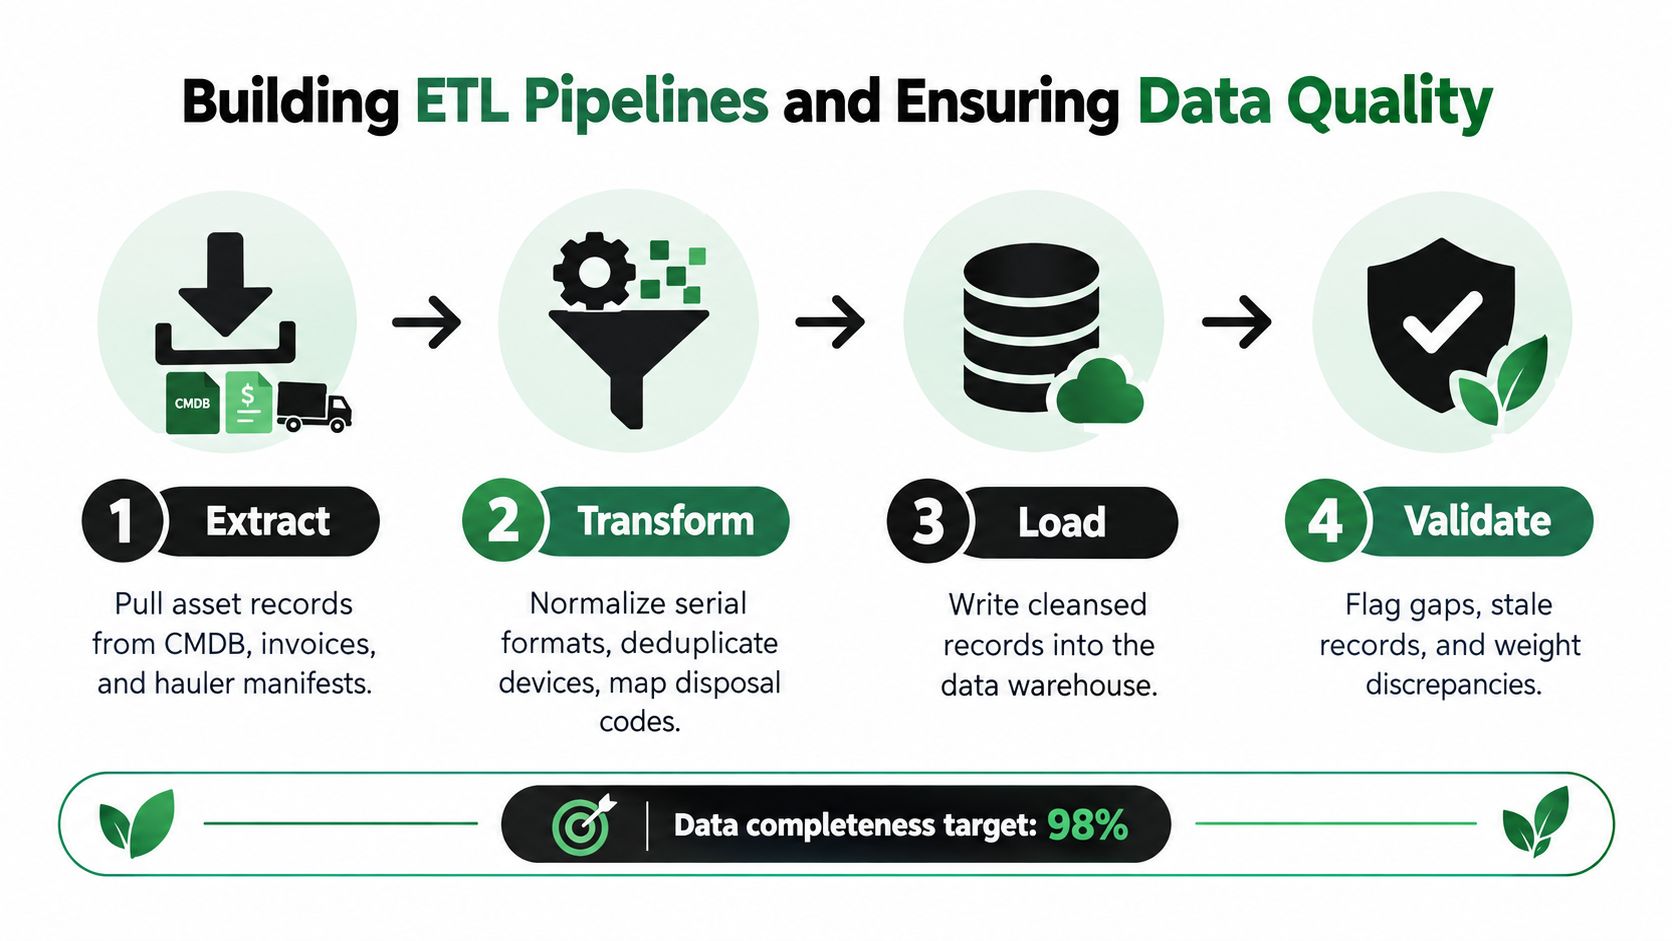
For ITAD, ETL means extract, transform, and load, followed by deliberate validation. The pipeline should preserve the original record, document each transformation, and flag uncertainty rather than fill gaps unannounced.
Ask and prepare
Start with the business question. A multi-site office cleanout might require answers to these questions:
- Which assets left each location?
- Which devices contained storage media?
- Which items received secure data destruction?
- Which equipment was eligible for reuse or donation?
- Which certificates and manifests support the final report?
Those questions determine the fields and relationships the pipeline needs. Extract data from the CMDB, procurement system, barcode files, invoices, warehouse logs, hauler manifests, and recycling partner reports. Keep source-system identifiers so analysts can trace a warehouse record back to its origin.
Preparation exposes the difficult gaps. A missing serial number shouldn't be treated like a valid identifier. A device with an inconsistent asset tag needs a review status. A logistics partner's weight may describe a shipment, while a recycler's weight may describe processed material. Those values can both be legitimate, but they must have distinct definitions and units.
Process, analyze, share, and act
The operational cycle described in this BI research paper follows Ask, Prepare, Process, Analyze, Share, Act. Applied to ITAD, processing standardizes serial formats, removes duplicate records, maps disposition codes, aligns dates and locations, and assigns each weight to a defined measurement event.
A semantic dictionary should define terms such as “retired,” “received,” “sanitized,” “recycled,” and “donated.” If finance considers an asset retired when it leaves service, while the recycler uses the term for material already processed, a shared dashboard will create false confidence.
Practical rule: Preserve ambiguity as a visible exception. A flagged record is safer than a clean-looking record built on an assumption.
Load the cleansed data into a warehouse or governed analytics platform, then validate completeness, freshness, duplicate rates, unmatched certificates, and weight discrepancies. The final dashboard should help a manager act, such as releasing a blocked shipment, requesting a missing certificate, or scheduling a follow-up pickup. A real-time inventory management resource can help teams think about operational visibility beyond a monthly spreadsheet.
Governance Security and Compliance in BI
Business intelligence data for retired hardware can contain two different kinds of sensitivity. The asset record may reveal procurement costs, locations, and organizational structure. The associated destruction record may connect an employee device or patient-care equipment to a security-controlled process. A governance model must protect both without preventing legitimate sustainability reporting.
Role-based access is the starting point. Sustainability teams may need totals by site, equipment category, disposition route, and material weight. They may not need to see a drive serial number or the identity of the technician who performed destruction. Security administrators may need certificate-level access. Finance may need retirement and recovery values. Executives often need summarized risk and environmental indicators.
Build an auditable chain
The NIST SP 800-88 guidance states that media sanitization must make data recovery infeasible using state-of-the-art laboratory techniques. Its destruction methods include processes such as melting media or reducing it to fine powder or dust. That standard makes the evidence model important. A dashboard should connect the asset identifier, sanitization method, responsible party, date, status, and certificate, while retaining the underlying document under appropriate access controls.
For regulated organizations, data governance should include:
- Least-privilege access: Show users only the fields required for their role.
- Immutable evidence: Retain original certificates and manifests rather than relying only on dashboard values.
- Exception workflows: Route missing or conflicting records to named owners.
- Retention rules: Define how long operational and compliance records remain available.
- Change history: Record who altered a classification, status, or disposition code.
An executive guide to GRC solutions can help leaders frame BI governance within broader risk, control, and compliance programs. The useful lesson is that the dashboard itself isn't the control. The control is the combination of governed definitions, restricted access, traceable transformations, and evidence that an auditor can inspect.
Align environmental and international obligations
The U.S. EPA's preferred electronics end-of-life hierarchy places reuse first, recycling second, and disposal last, as described in Congressional Research Service coverage of e-waste policy. BI data can test whether operating practice follows that order, but only if teams capture condition, reuse eligibility, donation status, and final material route separately.
International shipments require additional care. The EPA's international e-waste requirements state that, beginning January 1, 2025, covered shipments for recycling or disposal require prior written consent from importing and transit countries under Basel Convention amendments. Regulated U.S. hazardous waste movements also involve RCRA prior informed consent, shipment tracking, and confirmation of receipt and recovery. Those events belong in the compliance data model, not in an unstructured email thread.
For organizations using data destruction, medical equipment disposal, or laboratory equipment disposal workflows, governance should be designed before the first dashboard is published. Reworx Recycling's data security and compliance information is one reference point for evaluating how documentation, secure handling, and reporting fit into an ITAD process.
Modeling and Visualizing ITAD Metrics
A pie chart showing recycled versus landfilled material answers only a narrow descriptive question. It doesn't explain why one site has a backlog, whether a department retires equipment earlier than others, or which route should be prioritized for the next fleet refresh.
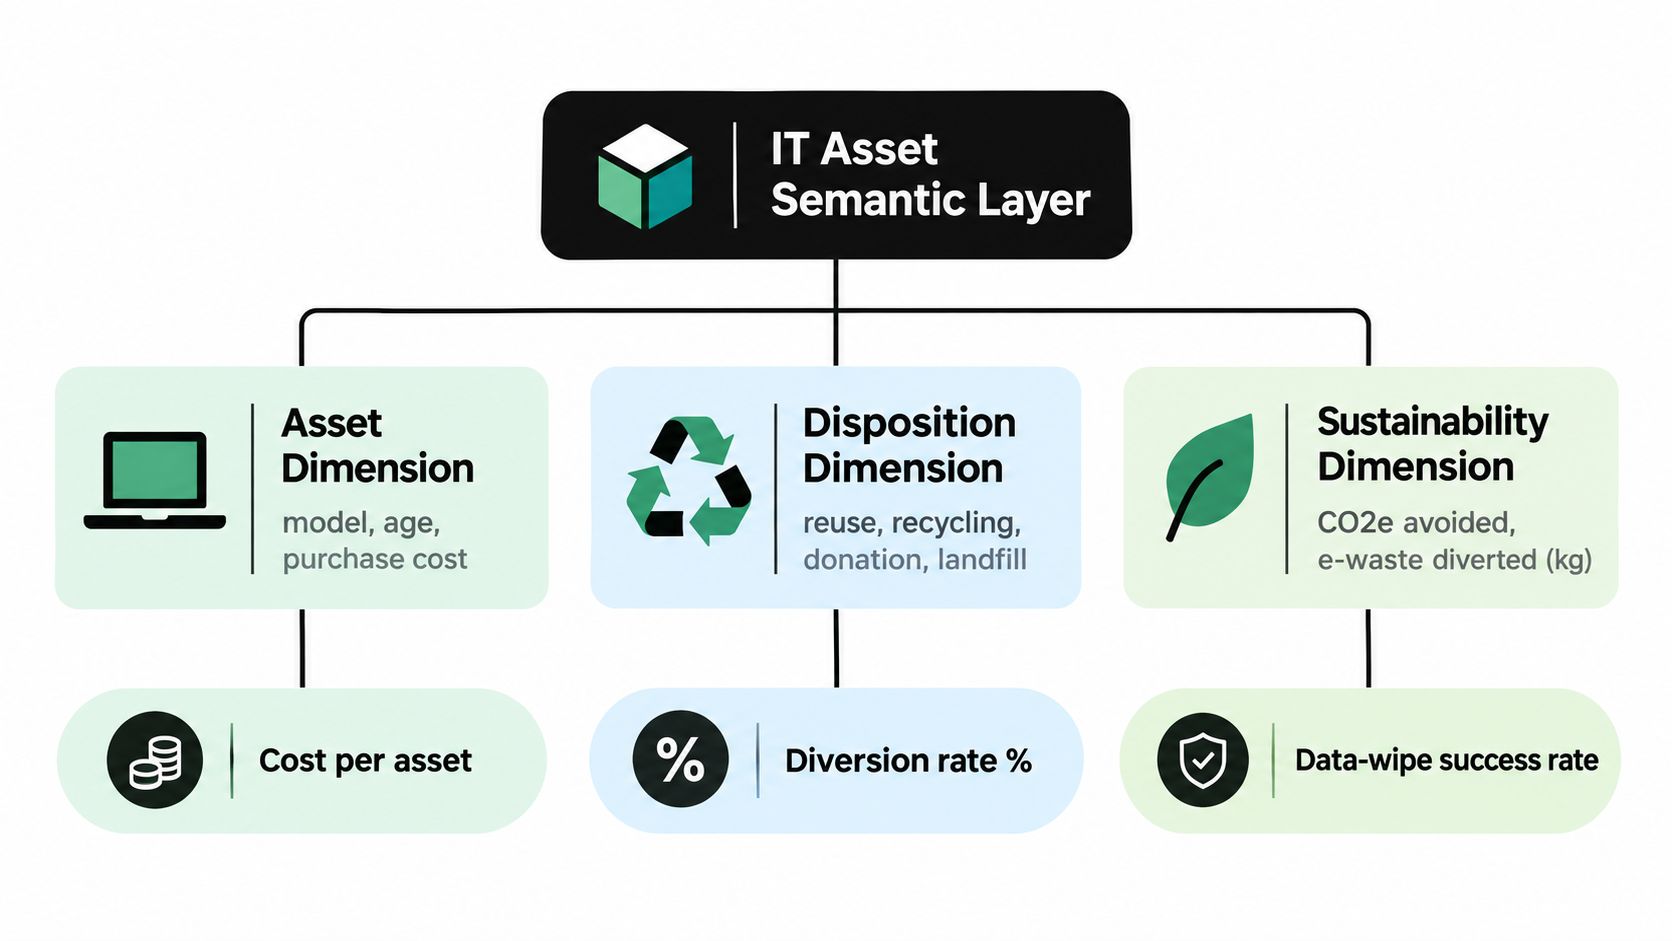
A stronger model uses a shared semantic layer. That layer translates operational fields into business terms that non-technical users can understand and data teams can govern consistently.
Organize the dimensions
Use the physical asset as the central entity, then connect related dimensions and events:
| Data area | Useful fields | Decision supported |
|---|---|---|
| Asset dimension | Model, age, purchase cost, department, location | Which equipment is approaching retirement? |
| Disposition dimension | Reuse, recycling, donation, landfill, destruction status | Which route was selected and completed? |
| Sustainability dimension | Material weight, e-waste diverted, estimated environmental indicators | What environmental outcome can the organization document? |
| Event records | Intake, transfer, sanitization, shipment, receipt, certificate | Can the organization reconstruct custody? |
Keep event data separate from descriptive attributes. An asset can move through several locations and statuses, while its model and original purchase details remain stable. This structure prevents a single spreadsheet row from trying to represent the entire lifecycle.
Progress from description to prescription
Descriptive BI might report the number of laptops retired during a reporting period. Diagnostic analysis can compare that result by department, device model, site, or failure reason. Predictive analysis can use procurement cycles, warranty history, and deployment patterns to anticipate future workload. Prescriptive analysis can recommend earlier collection, a different pickup sequence, or reuse screening before recycling.
A benchmark-oriented BI study describes evaluation across descriptive, diagnostic, predictive, and prescriptive query types, and presents BI-Bench as an unsupervised framework that doesn't require ground-truth annotations. Its BI-Bench research paper supports an important implementation principle: test whether the system answers meaningful operational questions, not merely whether it loads rows quickly.
Visual design should match the decision. Use exception views for missing certificates, aging queues for unprocessed assets, geographic views for distributed facilities, and drill-through records for audit support. Avoid presenting estimated environmental outcomes as measured facts. Label assumptions, preserve calculation logic, and let users move from a headline metric to the source events behind it.
For teams that need recurring operational interpretation, trend analysis reports can provide a useful reporting pattern, provided the underlying definitions remain stable.
KPIs and Use Cases for Sustainable Recycling
The right KPI connects a physical event to a business decision. “Equipment processed” is less useful than a metric that tells leaders whether assets were reused appropriately, whether security controls were completed, or whether the organization can support its environmental claims.
A practical scorecard should combine operational, security, material, and social outcomes.
Core measures for ITAD
Reuse and recycling mix shows how many assets entered reuse, donation, recycling, or disposal routes. This aligns reporting with the EPA hierarchy, where reuse comes before recycling and disposal. The metric needs clear inclusion rules. A laptop stored for possible reuse isn't the same as a laptop transferred to a community organization.
Data destruction compliance rate measures whether storage-bearing assets have the required sanitization evidence before release. Don't calculate it from a status field alone. Join the asset record to a valid certificate, method, date, and chain-of-custody event.
Certificate reconciliation identifies processed assets without matching recycling or destruction documentation. This is one of the most valuable audit views because it points directly to unresolved evidence rather than offering a flattering aggregate.
Pickup-to-receipt duration helps facilities and logistics teams identify delays. The usefulness comes from consistent event timestamps and agreed definitions, not from displaying a real-time number without context.
Donation and community access outcomes connect corporate donation programs to social enterprise recycling. Track equipment approved for donation, prepared for reuse, transferred, and accepted, while keeping recipient information protected where necessary.
Turning metrics into operating decisions
A school district might use the scorecard to separate working laptops from damaged units before a campus refresh. A government agency may need asset-level custody records for a facility cleanout. A healthcare organization may require stricter handling for medical equipment disposal, storage media, and devices associated with patient environments. A research organization may need separate workflows for laboratory equipment disposal and product destruction.
Reworx Recycling operates as a donation-based electronics recycling and IT equipment disposal social enterprise. Its service model includes business pickups, equipment decommissioning, serialized reporting, recycling and data destruction documentation, secure hard drive shredding, and options for equipment recovery. That makes it a potential operational partner for organizations that need computer recycling, laptop disposal, office cleanout, data center decommissioning, or sustainable recycling tied to documented outcomes.
The important distinction is between a report that counts material and one that supports accountability. When leaders can trace a donation, recycling event, or destruction certificate back to a unique asset, the KPI becomes evidence. When the same data helps teams choose reuse before disposal, it becomes an operating tool.
Implementation Best Practices for SMBs and Enterprise IT
Small and large organizations face different BI constraints. A small business may have one administrator, a spreadsheet, and a periodic office cleanout. An enterprise may have several CMDB instances, procurement systems, regional haulers, data centers, laboratories, and compliance teams. Both need trustworthy records, but neither should begin with an unnecessarily complex architecture.
The market context explains why scalability deserves attention. One industry report estimates the global BI market at USD 34.82 billion in 2025 and USD 37.96 billion in 2026, with a projection of USD 72.21 billion by 2034 and an 8.4% CAGR. Another estimate places the market at USD 41.16 billion in 2026 and USD 62.38 billion by 2031, implying an 8.67% CAGR. These estimates differ, but both describe sustained expansion in BI infrastructure. G2's business intelligence statistics also cites growth in tracked BI software products from 97 in 2021 to 237 in 2026, a 144% increase.
A practical split
| SMB priority | Enterprise priority |
|---|---|
| Establish one asset identifier | Govern identifiers across systems |
| Start with a controlled spreadsheet or lightweight database | Integrate CMDB, ERP, warehouse, and logistics feeds |
| Automate barcode capture at intake | Support event-level synchronization across sites |
| Review exceptions before publishing | Assign data owners and formal stewardship |
| Report a small set of KPIs | Maintain a shared semantic layer and audit history |
For an SMB, the first dashboard might cover assets awaiting pickup, assets received, destruction evidence, final disposition, and donation outcomes. That's enough to expose operational gaps without building a costly internal data lake.
Enterprise teams should consider zero-copy integration, hybrid cloud, or federated data patterns when duplicating sensitive records would increase risk or maintenance. They also need performance controls. A dashboard that takes too long to load won't support daily decisions, even if the data model is technically sound.
Launch checklist
- Name the owner: Assign responsibility for each critical field and exception queue.
- Define the terms: Document what “retired,” “recycled,” “donated,” and “destroyed” mean.
- Capture at intake: Use barcode or serial-number scanning before assets leave the site.
- Reconcile evidence: Match certificates and manifests to unique identifiers.
- Limit access: Separate sustainability summaries from sensitive destruction records.
- Review regularly: Schedule exception review and certificate audits.
- Scale deliberately: Add automation after the basic workflow produces reliable results.
The 2025 industry report cited by Business Wire's BI analysis reports that 87% of companies saw data volumes increase, 71% reported BI scalability problems, 76% cited slow dashboard or report performance, 80% lacked real-time data access, and 78% reported a shortage of skilled personnel. Those figures point to a practical conclusion for both segments: solve data ownership and workflow design before buying more visualization features.
Turning Data into Environmental Action
The strongest ITAD dashboard changes what people do next. It prompts a facilities manager to hold a shipment with missing custody records. It helps an IT director identify equipment suitable for reuse before ordering replacements. It gives a sustainability leader evidence for environmental reporting without relying on unsupported assumptions. It helps a city manager, school administrator, or corporate sustainability director connect technology retirement with responsible resource use and digital inclusion.
The environmental need is substantial. Global e-waste reached 53.6 million metric tonnes in 2019, was projected to reach 74 million tonnes by 2030, and only 17.4% of 2019 e-waste was collected and recycled, according to Building Circularity's electronics overview. Those figures make disposal routing more than a back-office concern. Every organization needs a defensible process for deciding what can be reused, what should be recycled, and what requires controlled destruction.
Treat the evidence as part of the outcome
A sustainability claim is only as credible as the records behind it. Asset identifiers, custody events, processing weights, destruction certificates, and final disposition codes should remain connected. If a team reports diverted material but can't explain how the figure was calculated, the dashboard creates reputational risk instead of reducing it.
The same principle applies to social impact. Donation-based recycling can support community technology access and workforce development, but the organization should distinguish equipment donated, equipment accepted, and equipment successfully prepared for reuse. That separation keeps community reporting honest and helps partners improve the handoff process.
A carbon view can complement operational reporting when its assumptions are documented. The carbon offset calculation resource can help teams structure that analysis, but estimated environmental benefits should remain clearly labeled as calculations rather than direct measurements.
Business intelligence data is therefore an operational necessity for ITAD. It protects sensitive information, supports audit readiness, exposes logistics failures, and gives sustainability leaders a reliable basis for action. Reworx Recycling's combination of electronics recycling, secure data destruction, business pickups, equipment decommissioning, donation programs, and reporting can support organizations that want to retire technology responsibly while contributing to community access and workforce development.
Reworx Recycling helps businesses manage serialized IT equipment retirement, secure hard drive shredding, responsible electronics recycling, donation-based reuse, and documented pickups for office, facility, and data center cleanouts. Visit Reworx Recycling to discuss your equipment lifecycle, schedule a pickup, or build an audit-ready ITAD and sustainability reporting process.